Cell Counting & Health Analysis

Cells in culture must be counted to monitor doubling time and for quantification prior to experiments or manufacturing processes. Cultured cells require routine monitoring not only for proliferation, but for viability, cytotoxicity and other measures of cell health. The choice of assay depends on the type of cells in culture, the study application, and the desired throughput. It is critical to quantify, or count, cultured cells prior to sub-culturing or downstream use in transfections, genomic studies, cryopreservation or other manipulations.
Featured Categories
We offer authenticated, contaminant-free cell lines, many in partnership with ECACC; critical tools for protein, antibody, virus, and vaccine production.
Discover our collection of validated human primary cells from PromoCell® human primary cells, primary blood and immune cells from BioIVT, and more.
ES and iPS cell-qualified products offer reliable culture solutions for stem cell researchers, including media and differentiation tools.
Ensure precise cell counts: handheld coulter counter delivers precise, rapid results. Opt for disposable hemocytometers in infectious environments.

Manual Cell Counting
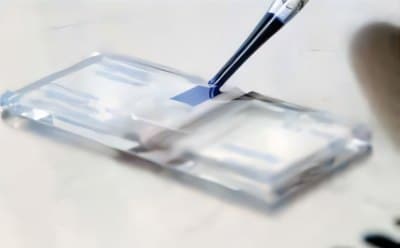
Cell counting chambers like the hemocytometer with Neubauer grids are common devices for manual/visual cell counting. A small aliquot of cell suspension is loaded onto the chamber of a gridded, precision-ground glass device , where it disperses over the etched grid by capillary action. The cells are visualized under the microscope and counted using a manual counter. The predefined volume of the chamber and the grid system are used to calculate the cell concentration. Imaging-based systems are available that automate the counting process.
Automated Cell Counting
Many automated cell counting devices use the same visual counting dyes and principles used in hemocytometry. Unlike automated cell counters that rely on object recognition, devices based on the Coulter principle have gained popularity for usability and precision. Coulter counters pump cell suspensions through a sensor that detects cells based on a change in electrical resistance. This allows more reliable detection of cells, even small cells, and high-accuracy cell counts. Portable models that are handheld (similar to a pipette) allow direct cell counts from the culture hood.
Cell Viability Assays
DNA synthesis: Monitoring active DNA-synthesis in cells is the basis for some cell proliferation assays. DNA replication can be measured by incorporating modified nucleosides, such as radioactive 3H-Thymidine or non-radioactive bromodeoxyuridine (BrdU) that is detected with an antibody.
Metabolic activity: Calorimetric assays that measure metabolic activity are suitable for analyzing cell proliferation, cell viability and cytotoxicity. The reduction of tetrazolium salts such as MTT, XTT and WST-1 to colored formazan compounds occurs only in metabolically active cells. The presence of ATP is also an indicator of metabolic activity. In the firefly luciferase reporter assay, ATP produced by dividing cells is used to oxidize D-Luciferin, which yields a bioluminescent light as the readout.
Dye exclusion: Trypan Blue staining is commonly used for viable cell counting. This method is based on the principle that live cells do not take up the dye, whereas dead cells take up the dye and appear blue under a microscope.
Fluorescent cell viability assays: 5(6)-Carboxyfluorescein diacetate N-succinimidyl ester (CFSE) labeling is a popular choice for measuring the number of completed cell division cycles in a cell population. Another membrane-permeable dye, Calcein-AM, is not fluorescent by itself, but emits a strong green fluorescence once it is hydrolyzed in a viable cell. In contrast, the nuclear dye propidium iodide (PI) can only reach the nucleus by passing through the compromised membrane of dead cells. Since both Calcein and PI-DNA can be excited with 490 nm light, simultaneous live/dead monitoring is possible with a single-excitation fluorescence microscope.
Visit our document search for data sheets, certificates and technical documentation.
Related Articles
- Scepter™ Cell Counter is a portable device which brings consistency in cell counting right to the culture hood in less than 30 seconds.
- Cellular apoptosis assays to detect programmed cell death using Annexin V, Caspase and TUNEL DNA fragmentation assays.
- Scepter™ counting is 7 to 10 times faster than hemocytometry-and also faster than other automated counters. Learn more about how this amazing technology works
- Detect mycoplasma contamination in cell culture through the PCR, DNA stain, or culture tests. Discover mycoplasma prevention, elimination, and detection kits.
- See All (17)
Related Protocols
- TLC separation relies on capillary forces to transport substances on a stationary phase after mobile phase transport.
- Powdered black pepper tested for pierine content follows USP guidelines using HPTLC and HPLC for dietary supplements.
- HPTLC was used to analyze caffeine in coffee. Filtration of coffee through a PTFE syringe filter was the only sample preparation. Quantitation was conducted with a TLC scanner.
- Silica gel G 254 plates are suitable for analysis of Dextromethorphan following the European pharmacopeia monograph.
- MTT assay protocol for measuring cell viability, proliferation and cytotoxicity. Instructions for MTT reagent preparation and examples of applications.
- See All (11)
Find More Articles and Protocols
How Can We Help
In case of any questions, please submit a customer support request
or talk to our customer service team:
Email [email protected]
or call +1 (800) 244-1173
Additional Support
- Chromatogram Search
Use the Chromatogram Search to identify unknown compounds in your sample.
- Calculators & Apps
Web Toolbox - science research tools and resources for analytical chemistry, life science, chemical synthesis and materials science.
- Customer Support Request
Customer support including help with orders, products, accounts, and website technical issues.
- FAQ
Explore our Frequently Asked Questions for answers to commonly asked questions about our products and services.
To continue reading please sign in or create an account.
Don't Have An Account?


